
Figure 4.
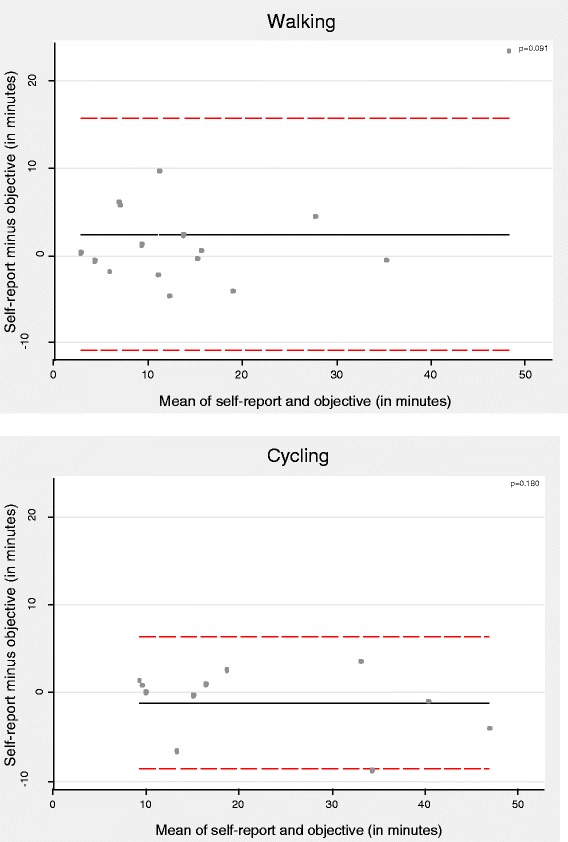
Bland-Altman plots for agreement between questionnaire-based usual times and objectively-assessed mean times spent walking and cycling. Solid lines indicate the mean difference, whilst dotted lines indicate the 95% limits of agreement.
Official websites use .gov
A
.gov website belongs to an official
government organization in the United States.
Secure .gov websites use HTTPS
A lock (
) or https:// means you've safely
connected to the .gov website. Share sensitive
information only on official, secure websites.
Bland-Altman plots for agreement between questionnaire-based usual times and objectively-assessed mean times spent walking and cycling. Solid lines indicate the mean difference, whilst dotted lines indicate the 95% limits of agreement.