
Fig. 1.
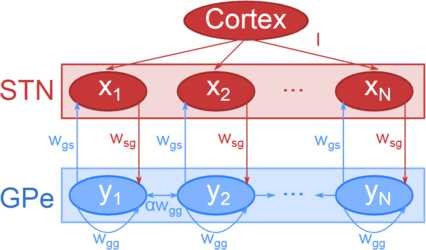
Model schematic. Schematic diagram showing the system arranged in a line topography, including the excitatory STN sub-populations, the inhibitory GPe sub-populations, and the connections between them. Red represents excitatory sub-populations and connections; blue represents inhibitory sub-populations and connections