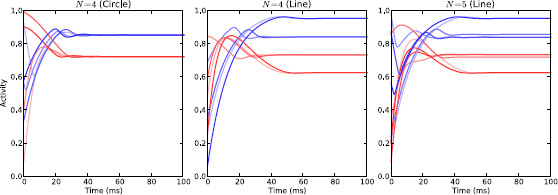
Fig. 11.

Steady state activity of coupled channels model. Steady-state activity of the healthy coupled channels model with and under three different configurations. The activity of the STN sub-populations is shown in shades of red and the activity of the GPe sub-populations is shown in shades of blue. Left: circular topology with four channels (same activity level across all channels); middle: line topology with four channels (pairs of channels with same activity); right: line topology with five channels (pairs of channels with same activity plus middle channel)
