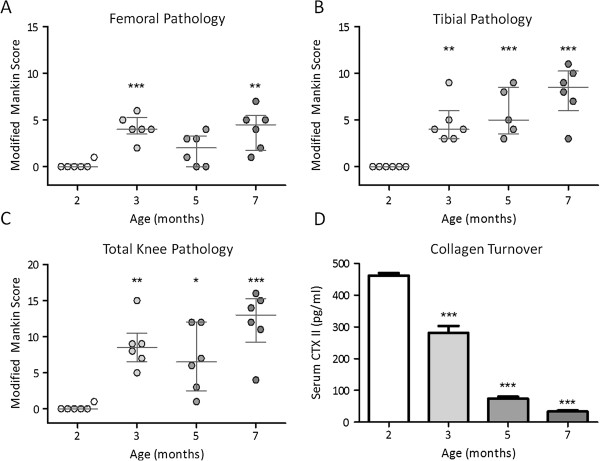
Figure 2.

Histological evidence of knee osteoarthritis on the femoral condyle (A), tibial condyle (B) and both condyles (C). Data are modified Mankin scores; error bars denote median ± interquartile range. (D) Mean serum CTX II concentration (pg/mL); errors bars denote SEM; * denotes P <0.05, ** denotes P <0.01, *** denotes P <0.001. All groups were compared to the 2-month age group.
