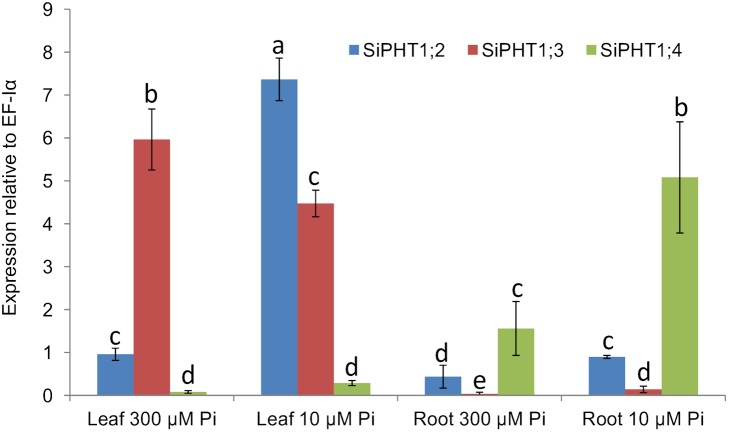
Figure 5. Quantitative real-time PCR analysis of SiPHT1;2, SiPHT1;3 and SiPHT1;4.
Quantitative real-time PCR analysis of SiPHT1;2, SiPHT1;3 and SiPHT1;4 expression in leaf and root samples of 15 d foxtail millet plants grown hydroponically in media containing either 300 µM or 10 µM Pi. Values are mean ± SE of 3 biological replicates each consisting of 3 technical replicates. The values were compared by one way ANOVA for the expression of genes. Values indicated by the same letter are not significantly different (p<0.05), based on a Bonferroni post-hoc test for the expression level of the same gene in different tissues.

