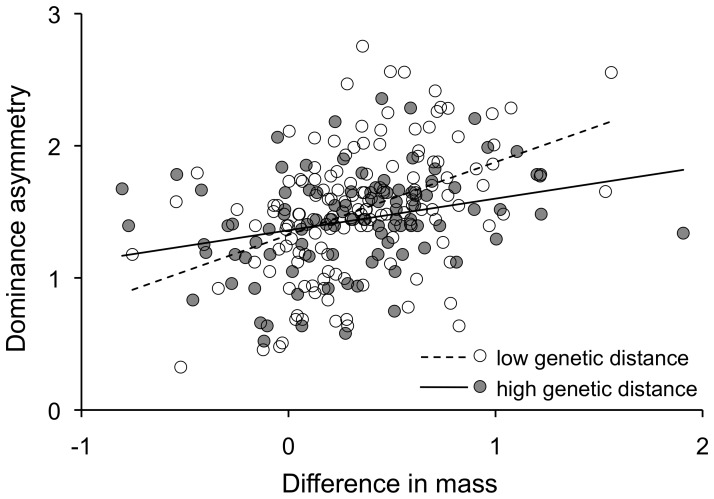
Figure 5. Relatively heavier bird species were more likely to win aggressive contests for resources (positive slope), but the advantage of large size in aggressive contests declined with genetic distance (shallower slope for high genetic distance).
Dominance asymmetry (y-axis) = sqrt {ln ((wins by dominant species+1)/(wins by subordinate species+1))}. Difference in mass (x-axis) = (mass of dominant species−mass of subordinate species)/(average mass of dominant and subordinate species). Genetic distance groups are split by the midpoint value for the dataset (low = 0.006–0.179; high = 0.180–0.352).

