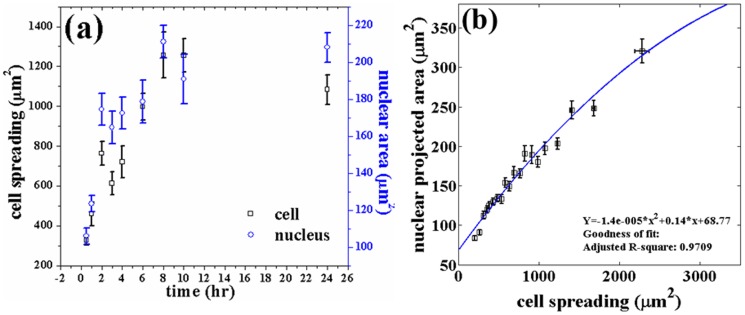
Figure 2. Variation of cell and nuclear projected areas studied as a function of dynamic cell spreading.
(a) Cell area and nuclear projected area as a function of time for cells grown on plastic surfaces for up to 24 hrs. For each time point around 50–60 cells were imaged and the average values of cell spreading and nuclear projected area is plotted as a function of time. (b) Relation between the two areas obtained from the data shown in Fig. 2a. This plot is obtained by binning the cell areas of all 540 cells. Binning size used was 27 and  is calculated using the curve fitting toolbox, MATLAB. Note, the difference in maximum spread area between the two figures arises due to this pooling and binning of data according to cell spread area. The smooth line is the fit from Fig. 1 given for the sake of comparison. The error bars in (a) and (b) are mean
  SE.
SE.

