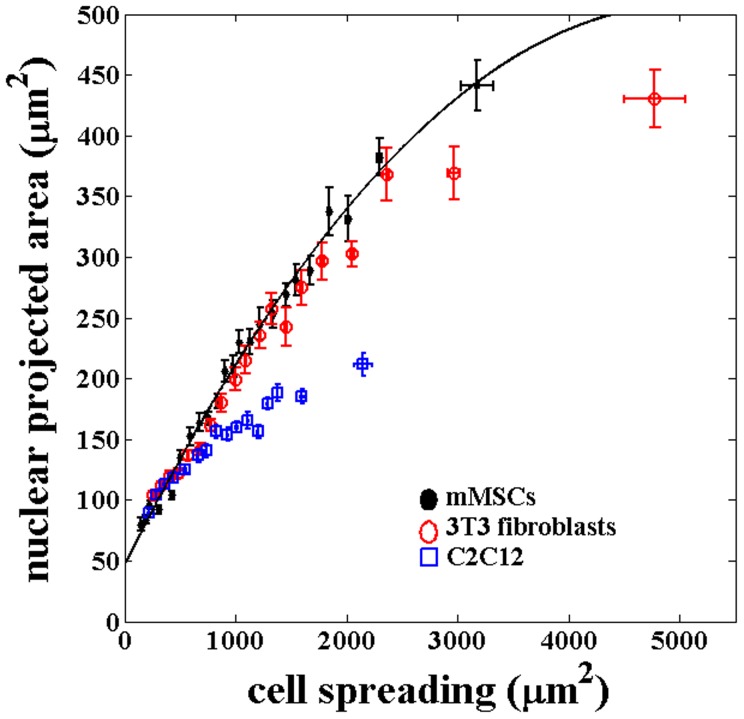
Figure 3. Plot of the cell and nuclear areas for three different cell types obtained using substrates with different stiffness.
For each substrate stiffness, nearly 100 cells were imaged for each type of cell. The data from all the substrates for, each type of cell, is pooled together and plotted after binning as done previously for mMSCs. The error bars here represents  SE. The correlated behavior between cell and nuclear projected area seem to be roughly intact even across these different cell types although the nuclear projected areas is reaching saturation at different values.

