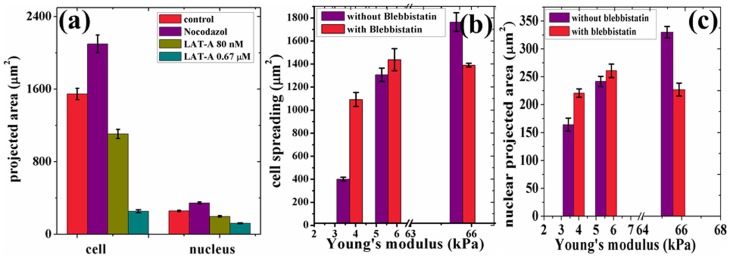
Figure 5. The robustness of the correlated behavior was tested against various cytoskeletal drug treatments.
(a) Changes in cell and nuclear projected areas after microtubule disruption using Nocodazole and actin depolymerisation using Latrunculin-A. (b, c) Variation in the two areas after treatment with blebbistatin to deactivate myosin-II. Note that substrate sensitivity is significantly diminished after mysosin-II inhibition. Further, for all drug treatments, a change in cell area causes a correlated change in nuclear area. All the values for the cell area and nuclear projected area are taken from over 80–100 cells in each case and the error bars in the plots represent standard error. Student t-test values are  and the comparison is with control for (a) and with 65 kPa substrate for (b).

