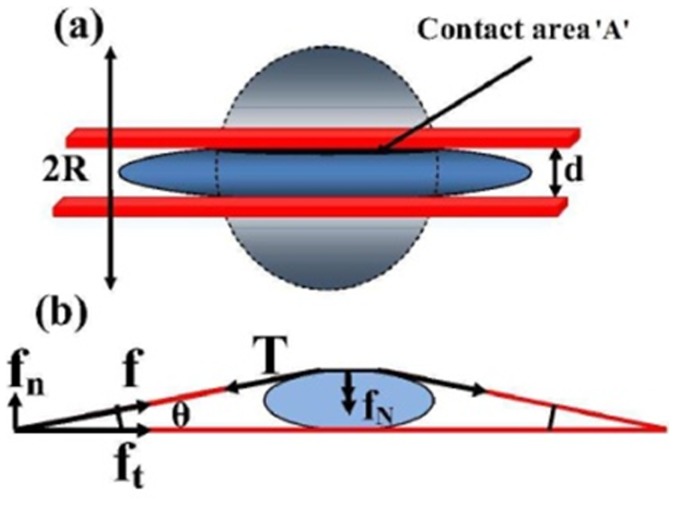
Figure 10. Diagrams showing the scheme used for the estimation of the compressive loading of the nucleus by stress fibers.
(a) Schematic showing nuclear deformation under uniform loading. The undeformed nucleus has a radius  . After loading the contact area with the plate is
  and the nuclear height is
  . (b) Schematic showing how normal stresses arise due to a perinuclear stress fiber.

