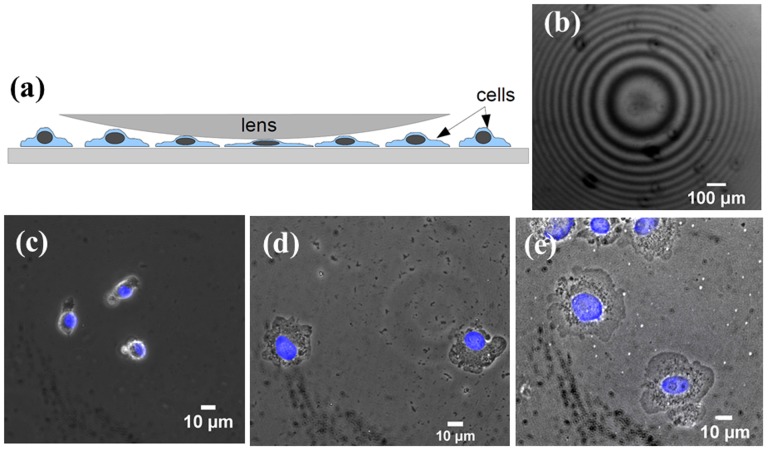
Figure 11. Nuclear compression experiment.
(a) Schematic of the arrangement used to apply an external compressive load on the nucleus. The pressure exerted on the cells is maximum at the central point determined by observing the interference pattern in reflected light (Newton's rings) as shown in (b). A 4x objective and 200 mm focal length lens were used for this image for better illustration of the pattern. (c–e) Phase contrast images showing the effect of a compressive load on cells applied using a convex lens (c) Cells outside the lens and (d,e) cells under lenses of two different weights, 0.97 g and 1.07 g respectively. The slight reduction in image quality is due to inclusion of the lens. An increase in cell spreading and nuclear projected area was observed with increasing load, shown quantitatively in master plot Fig. 6.

