
Figure 5.
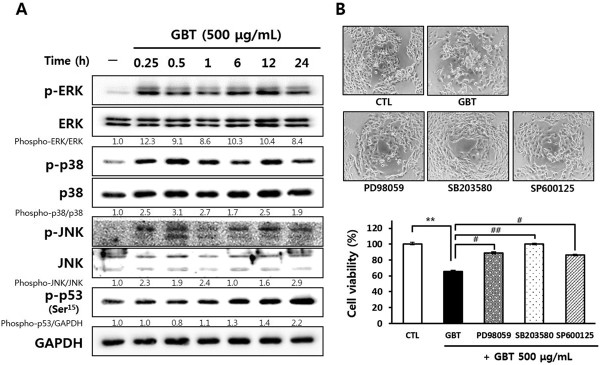
Identification of the relationship between MAPK activation and the anti-proliferative effect of GBT on A431 cells. (A) The activation of MAPKs and p53- Ser15P induced by GBT for the indicated times (0.25, 0.5, 1, 6, 12, and 24 h). Band intensity compared to untreated cells was calculated using ImageJ after normalization to GAPDH expression. The data represent two independent experiments. (B) The investigation of anti-proliferative effect of GBT for 48 h using the MAPK cascade inhibitors PD98059 (10 μM), SB203580 (10 μM), and SP600125 (10 μM). Cell morphology was observed under a phase-contrast microscope and cell viability was determined by MTT assay. The results show the means ± SD of two independent triplicate experiments. ** P<0.01 versus untreated control cells; and # P<0.05 and ## P<0.01 versus cells treated with GBT only.