
Figure 1.
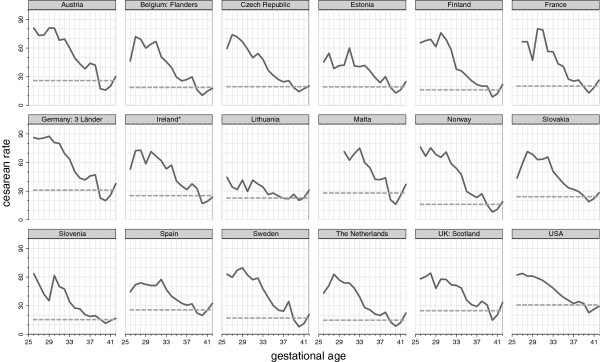
Cesarean rates for singleton births overall and by gestational age at delivery in 2008. Legend: ---------------- overall cesarean rate  cesarean rate by GA in completed weeks.
Official websites use .gov
A
.gov website belongs to an official
government organization in the United States.
Secure .gov websites use HTTPS
A lock (
) or https:// means you've safely
connected to the .gov website. Share sensitive
information only on official, secure websites.
Cesarean rates for singleton births overall and by gestational age at delivery in 2008. Legend: ---------------- overall cesarean rate cesarean rate by GA in completed weeks.