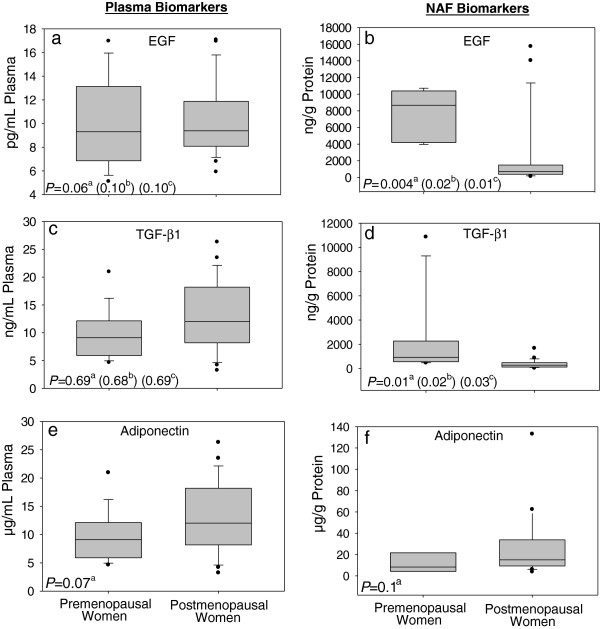
Figure 1.

Box plots illustrating differences between pre and postmenopausal women in plasma and NAF levels of Epidermal Growth Factor (EGF; a and b), Transforming Growth Factor Beta1 (TGF-β1; c and d) and Adiponectin (e and f). aP-values derived from linear regression models with controlling for BMI. bP-values derived from linear regression models with controlling for Adiponectin. cP-values derived from linear regression models with controlling for BMI and Adiponectin.
