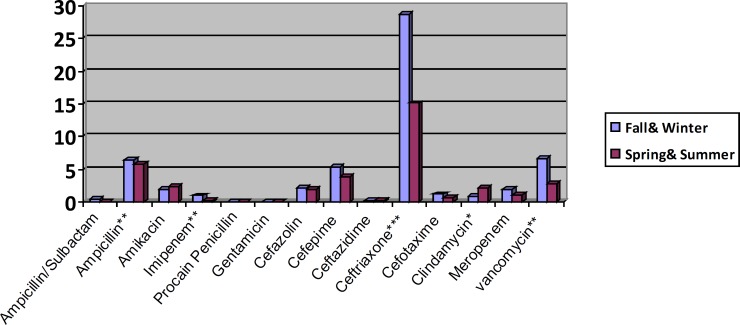
Chart 1.
Antibiotics consumption based on DDD/100 inhabitant/day p-value: comparison of mean differences of mg used of antibiotics in different time periods (e.g., Fall & Winter vs. Spring &Summer), obtained by independent samples t-test. *, ** and *** display p-value<0.05, <0.01 and <0.001 respectively.

