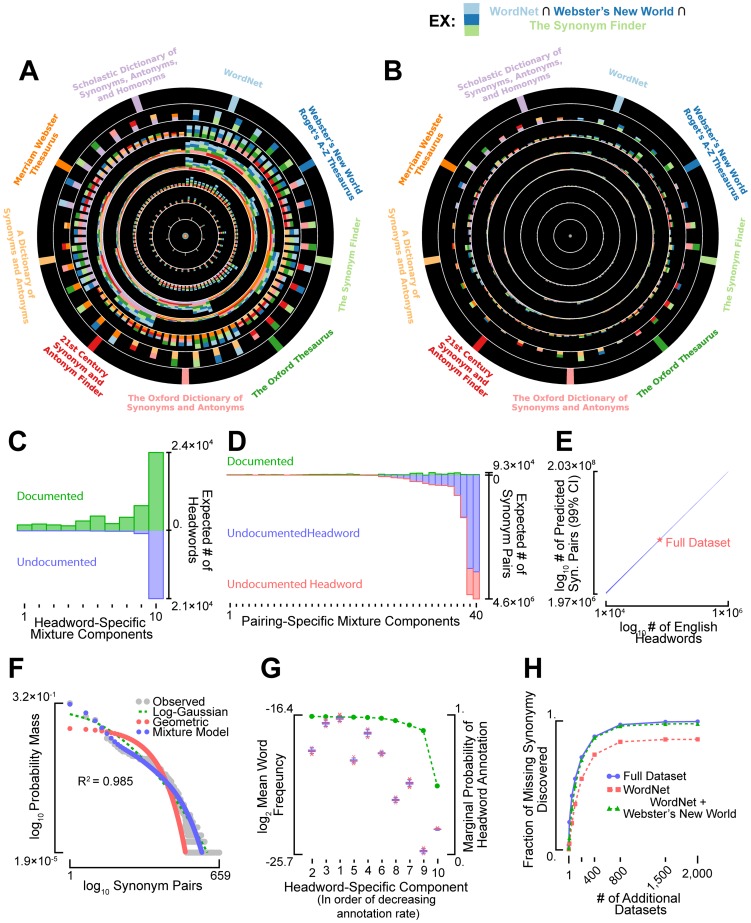
Figure 2. Most near-synonymous relationships among general English words are undocumented.
The overlap among the (A) headwords and (B) synonymous relationships annotated within nine general-English thesauri. (C) The number of known (above x-axis) and undocumented (below x-axis) headwords belonging to each of the ten, headword-specific mixture model components (see Supporting Information Text S1). (D) The number of known (above x-axis) and undocumented (below x-axis) synonymous relationships belonging to each mixture component. The blue bars indicate undocumented relationships paired to known headwords while the red bars indicate undocumented relationships paired to latent headwords. (E) The number of synonymous relationships is shown as a function of the total number of headwords in the English language. The width of the line indicates the 99% confidence interval for the estimate (see Supporting Information Text S1). (F) The distribution over the number of synonyms annotated per headword (gray) is compared to the theoretical distribution obtained using best-fitting statistical annotation model (blue). The R 2-value indicates the fraction of variance in synonym number explained by the model. For reference, log-Gaussian and geometric models were fit to the data as well (red and green, respectively), although their quality of fit was several thousand orders of magnitude worse than the best fitting annotation model (according to marginal likelihood). (G) Box-whisker plots depicting the mean relative word frequencies (1,000 bootstrapped re-samples) for each of the ten headword-specific mixture components. For reference, the probability of headword annotation, marginalized over all possible synonym pairs, is plotted in green. (H) The three curves indicate the expected fraction of undocumented synonymy that would be discovered upon repeatedly and independently constructing additional lexical resources (x-axis) identical to the complete dataset (blue), WordNet only (red), and WordNet plus Webster's New World (green).

