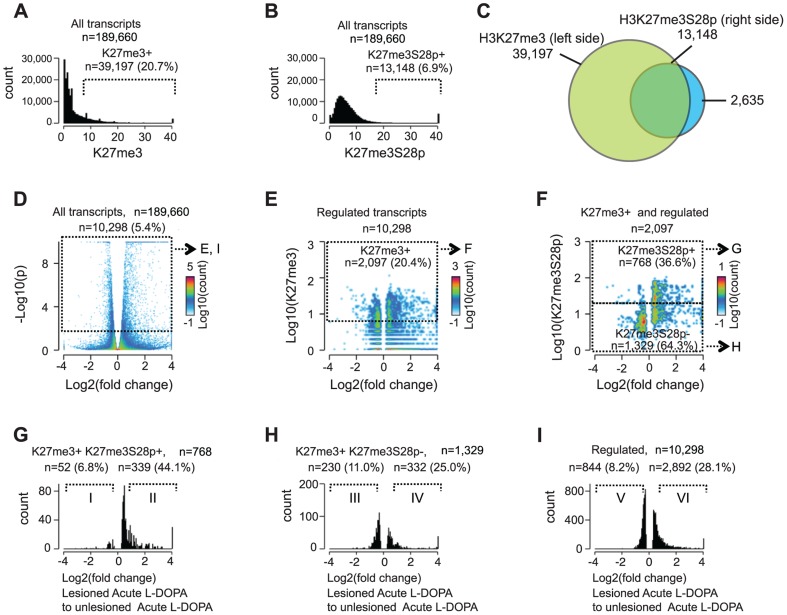
Figure 3. Induction of H3K27me3S28 phosphorylation genome wide correlates with an increase of mRNA transcripts from H3K27me3 marked gene loci.
Genome-wide correlation of expression data obtained by RNA-seq and H3K27me3 and H3K27me3S28p ChIP-seq data from lesioned and unlesioned striata of acute L-DOPA treated mice. A) and B) Histogram of the levels of H3K27me3 in the unlesioned striata (A) or H3K27me3S28p in the lesioned striata (B) at the TSS of genes (+/−1,000 bp). Values on x-axis are H3K27me3 levels (A) or H3K27me3S28p levels (B) normalized to reads per 1 kbp per 10 million reads (see Experimental Procedures). Genes were scored H3K27me3 positive (A) or H3K27me3S28p positive (B), respectively. C) Venn diagram to show the overlap between gene loci in the mouse genome which can give rise to a mRNA transcript that are marked by H3K27me3 in the unlesioned tissue sample from the left brain hemisphere, that gain H3K27me3S28 phosphorylation in the lesioned right brain hemisphere upon acute L-DOPA administration. D) Volcano plot of differentially expressed transcripts in the lesioned striata compared to the unlesioned striata after acute L-DOPA. Marked areas indicate regulated transcripts. E) 2D-histogram of transcripts that were regulated. Values on the x-axis correspond to log2 fold change in the expression level of the transcript, whereas y-axis values correspond to the quantitated H3K27me3 levels at TSS of the corresponding gene (normalized to general H3). Of the regulated transcripts, 20.4% originated from genes that scored H3K27me3 positive according to the threshold mentioned in A (marked area). F) 2D-histogram of regulated transcripts originating from H3K27me3 positive genes. Values on the x-axis correspond to log2 fold change in the expression level of the transcript, y-axis levels correspond to the quantitated, normalized, H3K27me3S28p levels at TSS of the corresponding gene. G–I) Histograms of the fold change in expression of the H3K27me3S28p positive and H3K27me3 positive genomic loci (G), H3K27me3S28p negative, but H3K27me3 positive genomic loci (H), and all regulated transcripts (I). H3K27me3S28p positive transcripts (G) are much more frequently induced than H3K27me3S28p negative (H) or regulated transcripts in general (I). Roman numerals indicate the subpopulations used for Gene Ontology Enrichment Analysis (Figure S4).

