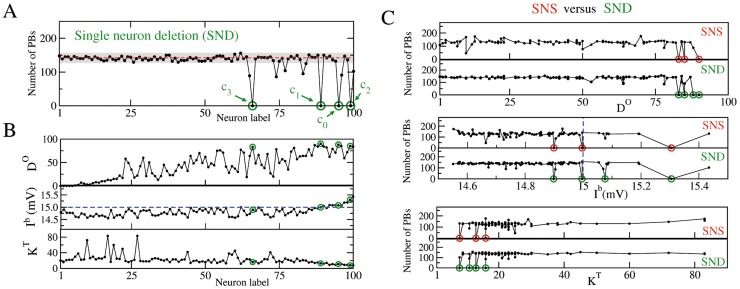
Figure 2. Comparison between single neuron stimulation (SNS) and deletion (SND) in a network with correlations of type  plus
plus  .
.
(A) Number of PBs emitted during SND experiments versus the label of the removed neuron. (B) Functional and structural properties of the network, as measured in control conditions, i.e. in absence of any stimulation/manipulation of the neurons. From top to bottom: functional out-degree  , intrinsic excitability
  , and total structural connectivity
  . The red dashed line and the gray shaded area in (A) as well as the neuron labels are as in Fig. 1 C, the blue dashed line denotes
  mV. (C) Comparison between SNS and SND: the number of PBs occurring during SNS (resp. SND) is reported as a function of
  ,
,  and
and  . In all panels the green (red) circles mark the critical neurons, which under SND (SNS) can silence the bursting activity of the network. The bursting activity is recorded over an interval
  s.
s.

