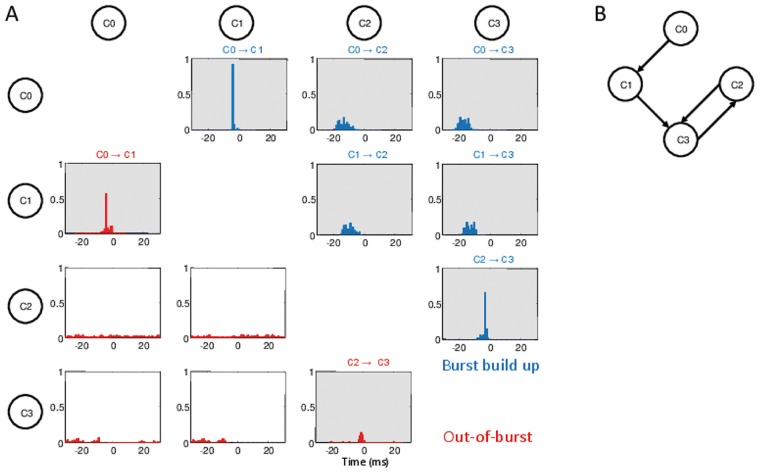
Figure 4. The functional clique.
(A) Cross correlation functions C( ) between the spike trains of two critical neurons.
  has been measured as the position of the maximum of the cross correlation between the time series of the two considered neurons. The panels refer to all the possible pair combinations of the critical neurons, furthermore blue (red) histograms refer to the analysis performed during the population burst build up (during periods out of the bursting activity). For more details see the subsection Functional Connectivity in Methods. The order of activation of each pair is reported on the top of the corresponding panel, whenever the cross-correlation has a significant maximum at some finite time
  . Note that during the PB onset, neurons activate reliably in the following order
  . During the out-of-burst activity, clear time-lagged activations are present only among the pairs
  -
- and
and  -
- . (B) Structural connections among the four critical neurons: the black arrows denote the directed connections. The data here reported, as well in all the following figures, refer to a network with correlations of type T1 plus T2.

