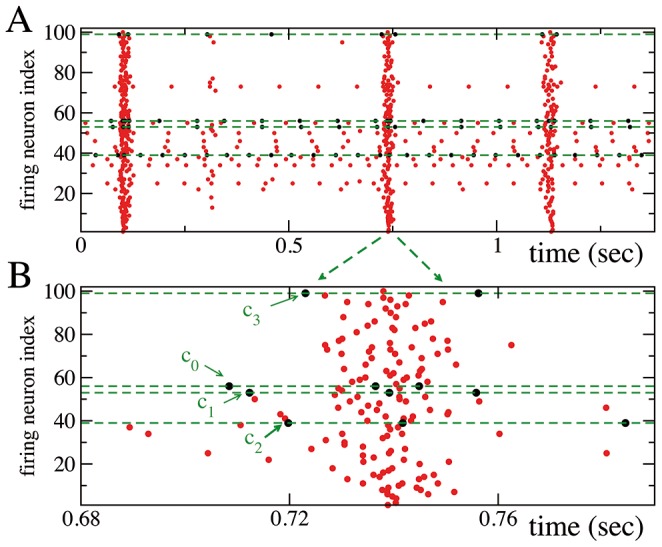
Figure 5. The critical neurons precede the population bursts in a network with correlations of type  plus
plus  .
.

(A) Raster plot of the network activity: every dot denotes a firing event. The dashed green lines and black dots refer to the four critical neurons. (B) Enlargement of a representative population burst: PBs are anticipated by the ordered firing sequence  . For clarity reasons, in the raster plots, at variance with all the other figures, the neuronal labels are not ordered accordingly to their firing rates.
