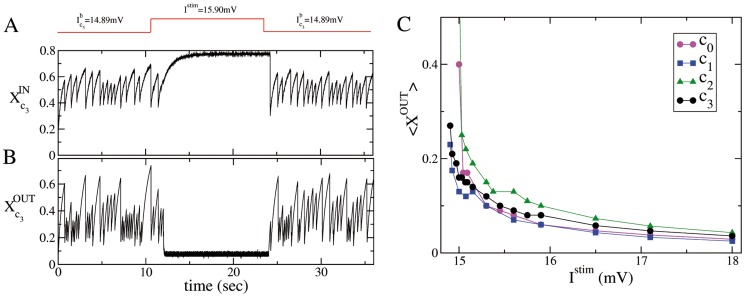
Figure 6. Effective synaptic strength during single neuron current stimulation.
Average synaptic strength of the afferent (A), and efferent (B) connections of the critical neuron  during SNS with
  mV (these data corresponds to the experiment reported in Fig. 1). The output (input) effective synaptic strength is measured in terms of the average value of the fraction
  (
( ) of the synaptic transmitters in the recovered state associated to the efferent (afferent) synapses (see Methods). (C) Time averaged synaptic strengths
  as measured during SNS experiments performed on each of the four critical neurons for various stimulation currents
  . The legend clarifies to which neuron corresponds the average synaptic strengths displayed in the figure, the averages have been performed over 84 s.

