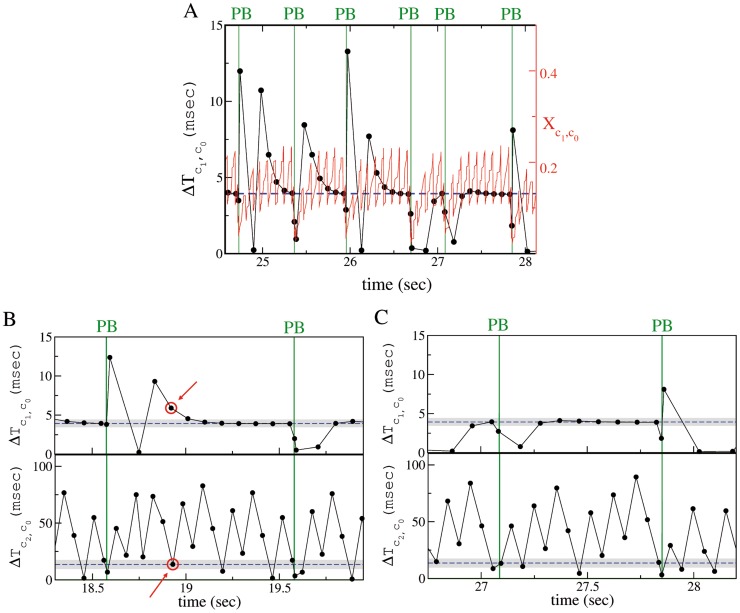
Figure 7. (A) Synapse strength and firing time delay between the neurons  and
and  .
.
Time evolution of the effective synaptic strength  (red solid line and right y-axis) and of the firing time delay
  (black line with dots and left y-axis). (B),(C) Failures and successes in population burst ignition. Spike time delay
  (top panel) and
  (bottom panel) of neuron
  and
and  , respectively, referred to the last firing time of
  . Panels (B) and (C) clearly show that PBs (denoted by green vertical lines) can occur only when the neuron
  and
and  fire within precise time windows after the firing of neuron
  . In (B) a clear failure is indicated by red circles, in this case
  fired at the right time, but
  was too slow; in (C) neuron
  fires at the right moment several times (black dots are within the gray shaded area in the top panel), but the avalanche is not initiated until
  does not emit a spike within a precise time interval after the firing of
  . In all the figures, the data refer to control conditions. The blue horizontal dashed lines refer to the average value of
  or
or  at the PB onset, while the shaded gray areas indicate the corresponding standard deviations.

