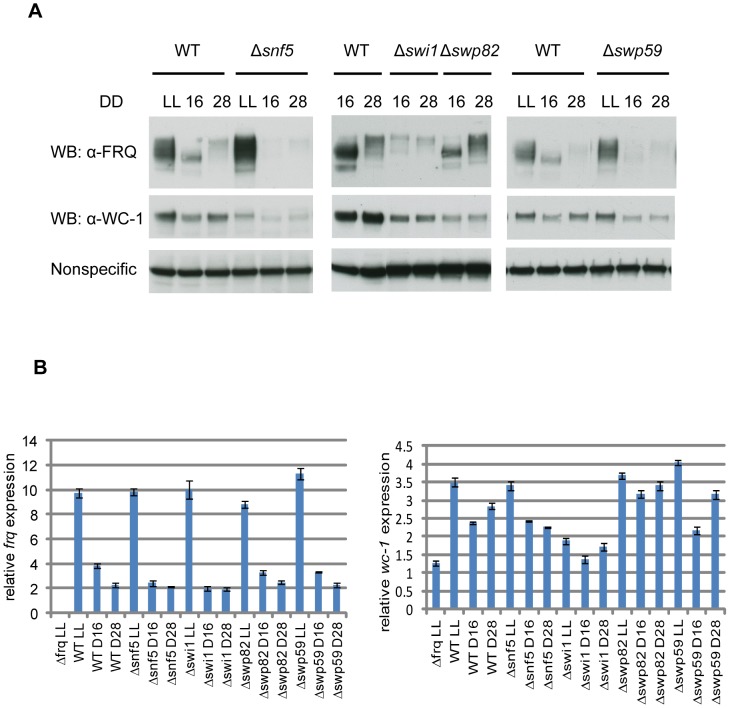
Figure 3. Loss of FRQ expression in SWI/SNF subunit knockouts.
(A) Expression levels of FRQ and WC-1 were followed by Western blotting in WT, Δswp59, Δswi1, and Δsnf5. Two dark time points were chosen to examine FRQ expression, CT5 (DD16) when newly synthesized FRQ is seen and CT17 (DD28) when old FRQ is hyperphosphorylated and begins to be degraded in WT. Non-specific bands were shown for equal loading. (B) Corresponding data for frq and wc-1 mRNA is shown.

