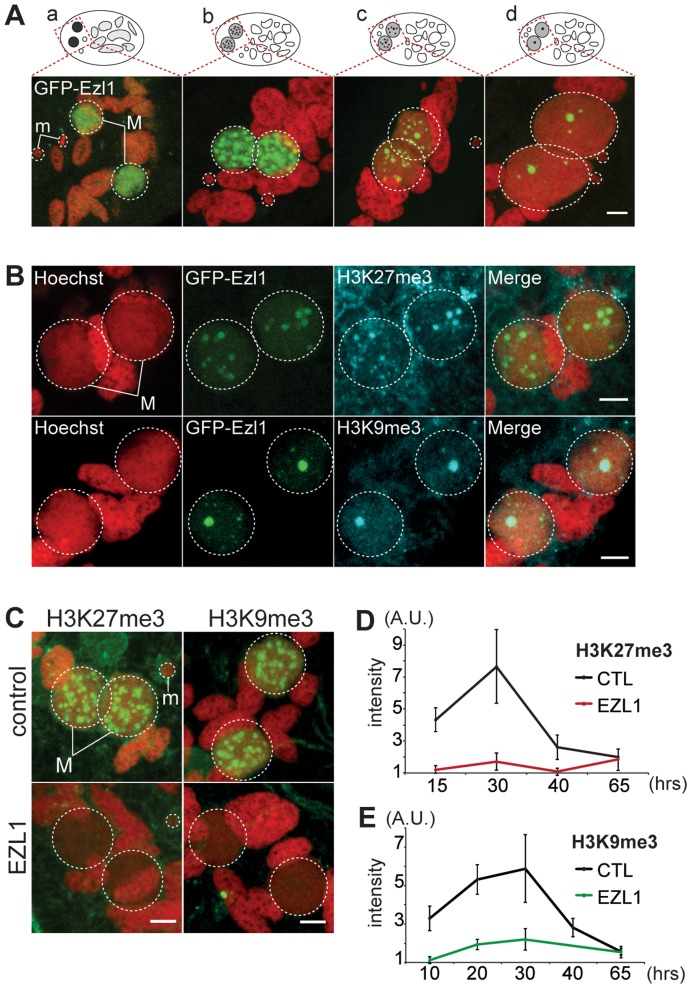
Figure 4. EZL1 is required for H3K27me3 and H3K9me3 in the developing somatic MAC.
A. GFP-EZL1 localization in the developing new somatic MAC. Overlay of Z-projections of magnified views of GFP-EZL1 (in green) and Hoechst (in red) on selected stacks at different stages of development of the somatic MAC (a-d) are presented. See Figure S8 for the entire images and a description of the staining throughout the life cycle. Dashed white circles indicate the two developing MACs (M) and the MICs (m) when visible. The other Hoechst-stained nuclei are fragments from the old vegetative MAC. The grey to black color represents the GFP-EZL1 intensity. Scale bar is 5 µm. B. Co-localization of GFP-EZL1 fusion protein and H3K27me3 or H3K9me3. GFP-EZL1 transformed cells were immunolabeled with H3K27me3- or H3K9me3- antibodies and stained with Hoechst at 40 hrs during autogamy. Overlay of Z-projections of magnified views of GFP-EZL1 (in green), H3K27me3- or H3K9me3- specific antibodies (in blue), and Hoechst (in red) on selected stacks are presented. Dashed white circles indicate the two developing MACs (M). Scale bar is 5 µm. C. Immunolabeling with H3K27me3- or H3K9me3- antibodies (in green) and staining with Hoechst (in red) in ND7 (control) or EZL1 knockdown cells at 30 hrs. See Figure S4 for progression of autogamy and quantification of the number of stained cells at each time point. Dashed white circles indicate the two developing MACs (M) and the MICs (m) when visible. Scale bar is 5 µm. D. Quantification of H3K27me3 or H3K9me3 fluorescence intensities in the developing MACs. At each time point, the mean of fluorescence intensities was calculated for ten individual cells after control or EZL1 silencing (see Materials and Methods). Errors bars represent the standard deviation.

