
Figure 4.
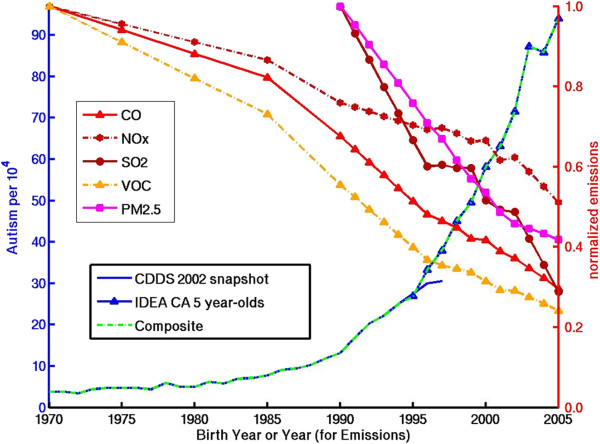
Temporal trend in autism compared to trends in highway sector emissions of direct PM2.5 and indirect PM2.5 and ozone precursor species. Emissions are normalized to the 1970 values for CO (=163 Mtons), NOx (=13 Mtons), and VOCs (=17 Mtons) and to the 1990 values for SO2 (=0.5 Mtons), and direct PM2.5 (=0.3 Mtons).