Figure 1.

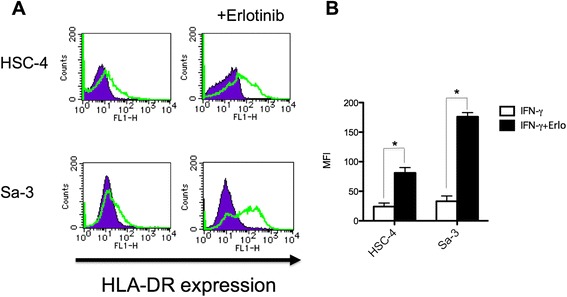
Alteration of HLA-DR expression in HNSCCs by EGFR inhibitor. (A) HLA-DR expression of HNSCC cell lines HSC-4 and Sa-3 was examined by flow cytometry. HNSCC cells were treated with IFN-γ (50U/ml) alone or with IFN-γ and erlotinib (1 μM) for 48 h. Purple graph: isotype control antibody, Green graph: anti HLA-DR antibody. (B) Mean fluorescence intensity (MFI) of HLA-DR expression was shown. Columns: means of triplicate determinations, bars: SD. Results are representative of at least two separate experiments. *p < 0.05.
