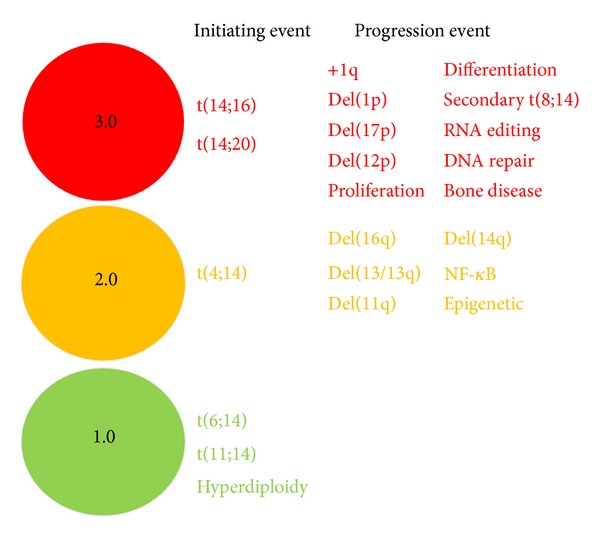
Figure 1.

The RAG model. The genes and categories selected for the RAG model are placed into their respective red, amber, and green groups. To generate a RAG score, the average score for lesions correlating between a patient sample and the model is calculated. The RAG score is then used for risk stratification.
