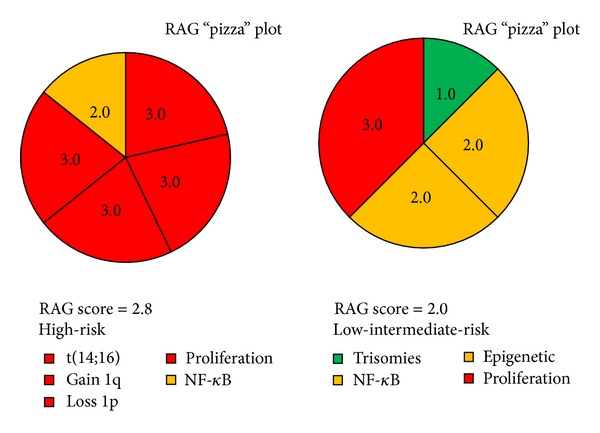
Figure 2.

RAG “pizza” plots. The RAG “pizza” plots are colour plots which represent how the RAG score will be presented. The size of the segment each aberration represents is proportional to the “weighting” that lesion is given in calculating the RAG score; that is, a red group lesion will be represented by a larger segment when compared to the segments of amber and green lesions. Representation of the RAG score as a “pizza” plot helps to visualize the score and improve understanding.
