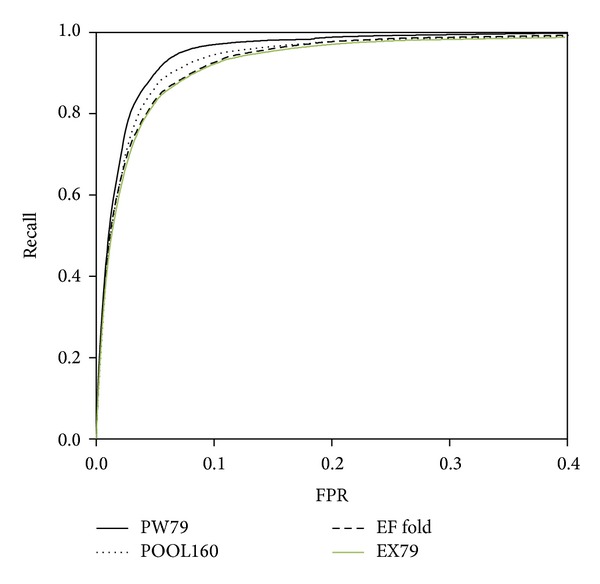
Figure 5.

ROC curves for PW79, POOL160, EF fold, and EX79 dataset. The prediction performance using structure features combined with sequence conservation. The AUCROC for the PW79, POOL160, EF fold, and EX79 dataset are 0.973, 0.965, 0.968, and 0.964, respectively.
