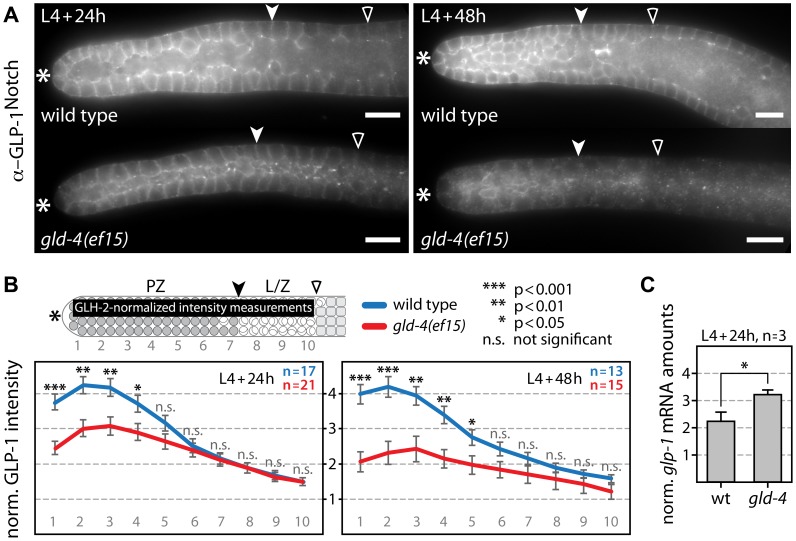
Figure 3. GLD-4 promotes endogenous GLP-1 expression.
(A) Median images of extruded gonads stained with α-GLP-1 antibodies in given genetic backgrounds and at two developmental time points. Asterisk, distal tip; arrowhead, mitosis-to-meiosis boundary; empty carat, beginning of pachytene. Scale bars: 10 µm. (B) Quantification of the distal region of immunostained germ lines (n) from A. The α-GLP-1 fluorescent signal was normalized to α-GLH-2 signal. The values of the y-axis represent arbitrary units. Error bars are SEM; p values from Student's t-test. The top scheme indicates the area used for intensity measurements in the distal germ line (black bar). PZ, proliferative zone; L/Z, leptotene/zygotene; other label as in A. (C) Quantification of endogenous glp-1 mRNA levels by RT-qPCR normalized to rpl-11.1 mRNA. Error bars are SEM. *, p<0.05 (Student's t-test).

