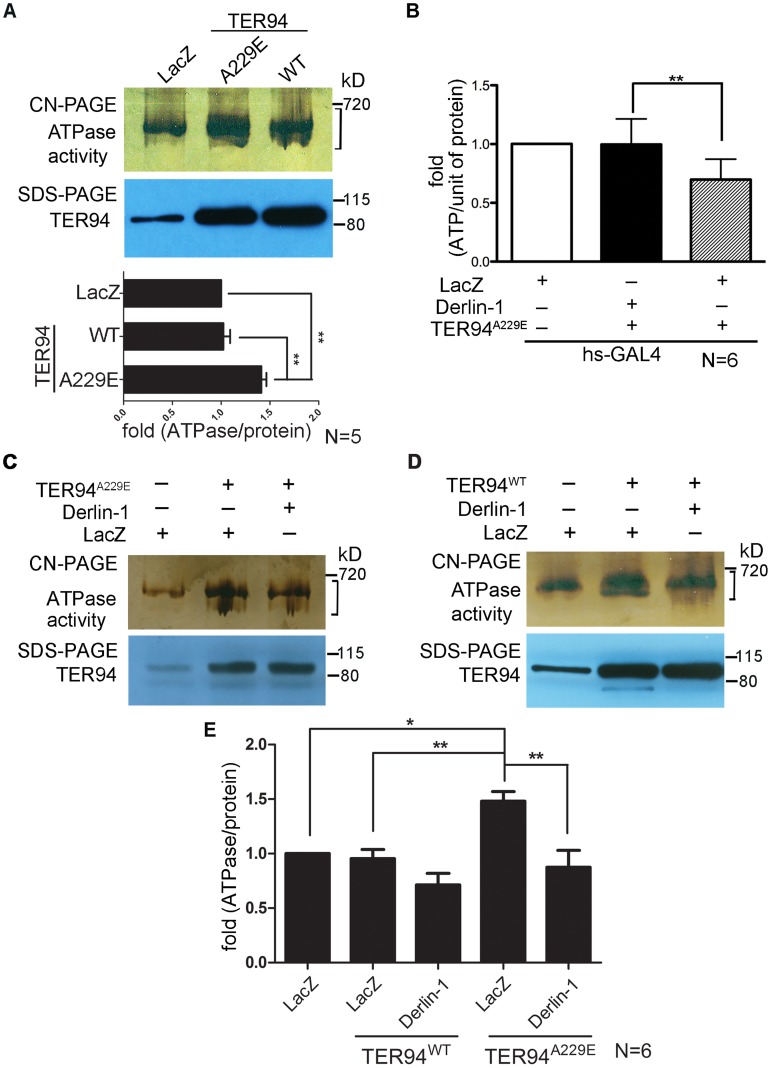
Figure 3. Overexpressing Derlin-1 suppresses the ATPase activity of pathogenic TER94 mutant.
(A, C and D) In-gel ATPase activity assay of indicated transgenes driven by hs-GAL4; tub-GAL80ts. The ATPase activity presented with bands intensity (see Materials and Methods) from the clear-native (CN)-PAGE was normalized by TER94 protein levels in SDS-PAGE. A bracket marks the measured bands for this representative CN-PAGE. Quantification of ATPase activities from flies expressing LacZ control and TER94 transgenes in panel A is shown. Values represent the mean± SE from five independent experiments. **p<0.01 (one-way ANOVA with Bonferroni's multiple comparison test). (B) Measurement of cellular ATP levels in flies carrying indicated transgenes driven by hs-GAL4. Values represent the means ± SE from six independent experiments (**p<0.01; one-way ANOVA with Bonferroni's multiple comparison test). (E) Measurement of ATPase activities from C and D. Values represent the mean± SE from six independent experiments. *p<0.05; **p<0.01 (one-way ANOVA with Bonferroni's multiple comparison test).

