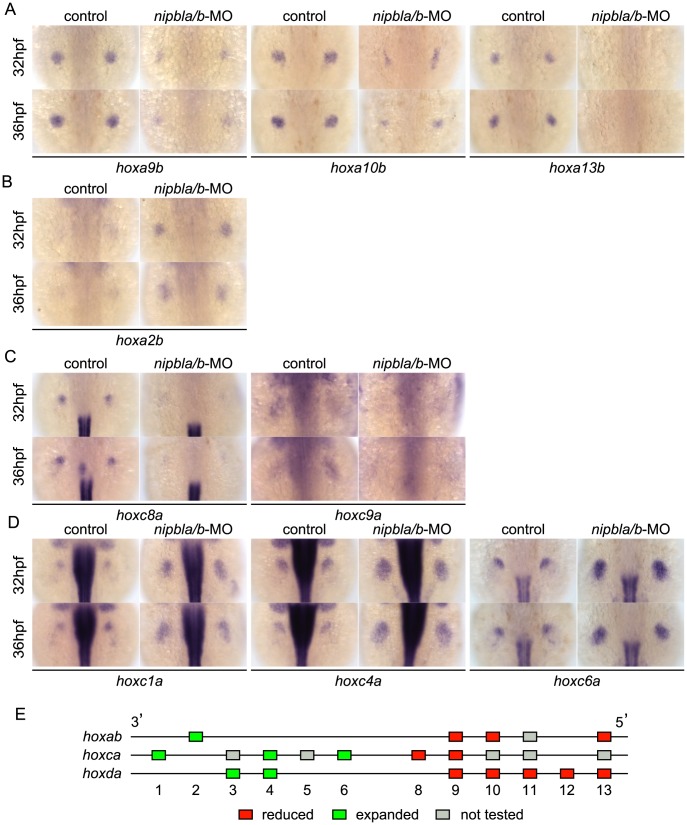
Figure 5. Nipbls regulate hox gene expression according to genomic location.
(A–D) Expression of genes in hoxab (A,B) and hoxca (C,D) clusters was examined by ISH. (A) 5′-hoxa, (B) 3′-hoxa, (C) 5′-hoxc, and (D) 3′-hoxc genes. Dorsal views, anterior to the top. (E) Diagram summarizing effects of Nipbl reduction on hox genes. Genes located closer to 5′-ends show reduced expression (red boxes) whereas those closer to 3′-ends become expressed across entire fin buds (green boxes).

