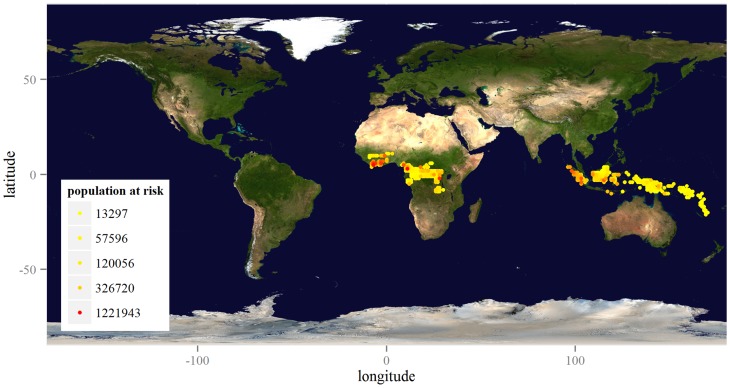
Figure 2. Geographic distribution of the estimated population at risk in 12 known endemic countries.
The legend gives the quintile values for the population at risk living within one-degree latitude by one-degree longitude cells (approximately 100 km by 100 km). Map credit: NASA Goddard Space Flight Center Image by Reto Stöckli (land surface, shallow water, clouds). Available at http://visibleearth.nasa.gov/view.php?id=57752.

