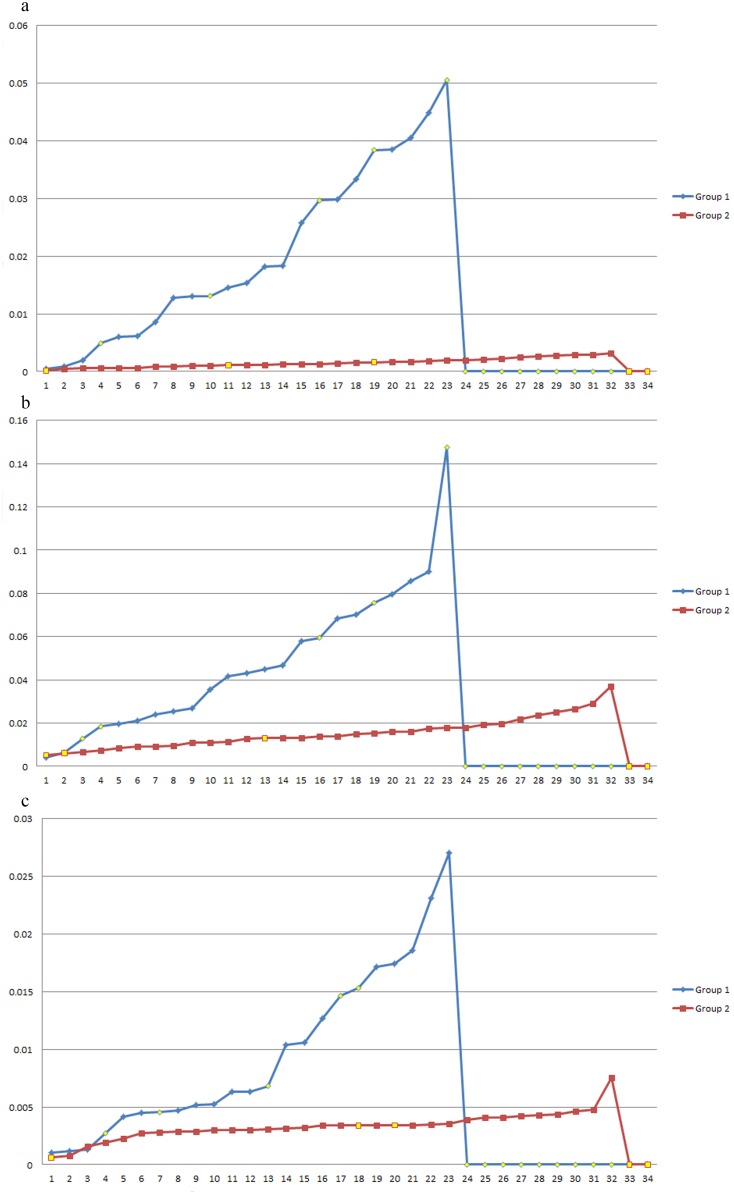
Figure 4. Line charts of variances of base distance, codon distance, and amino acid distance for phylum-divided groups and genomic GC content-divided groups.
Group 1: the data were divided based on phylum; Group 2: the data were divided based on genomic GC content. a) Y: Base distance variances; X: sections. b) Y: Codon distance variances; X: sections. c) Y: Amino acid distance variances; X: sections.

