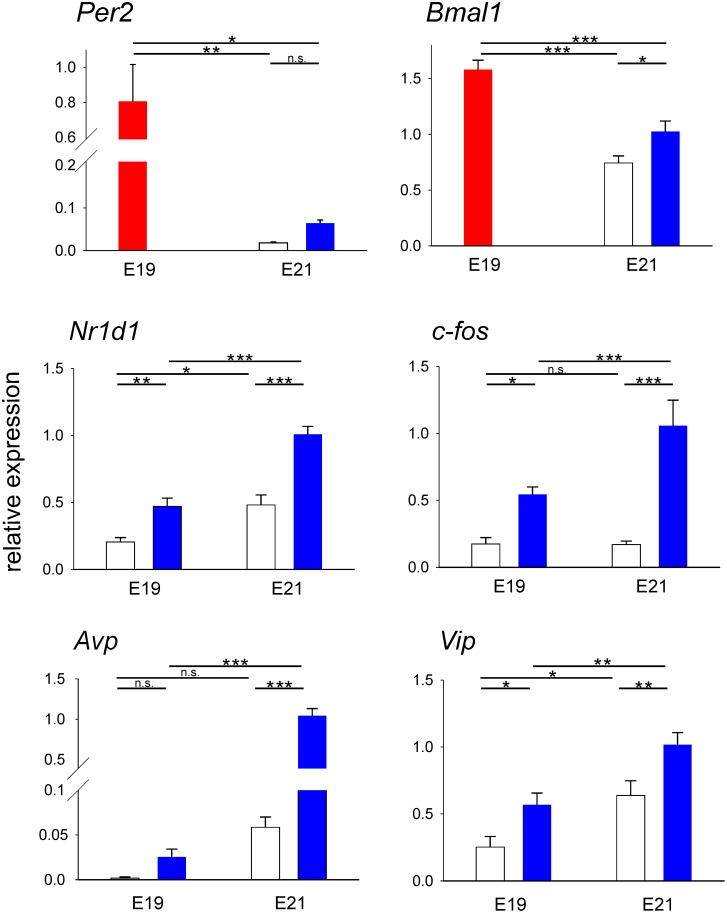
Figure 4. The comparison of gene expression levels in the rat SCN at E19 and E21.
Relative expression of Per2, Bmal1, Nr1d1, c-fos, Avp and Vip was detected at both fetal stages. SCN samples collected at time points representative of minimal (open columns) and maximal (blue columns) transcript levels during the 24-h interval (see Fig. 2 and Fig. 3) were assayed in the same PCR assay. For the non-rhythmically expressed Per2 and Bmal1 at E19, the mean of maximal and minimal levels is shown (red column). The results of a one-way ANOVA comparison between the groups are shown. *P<0.05, **P<0.01, ***P<0.001, n.s., non-significant.

