
Figure 3.
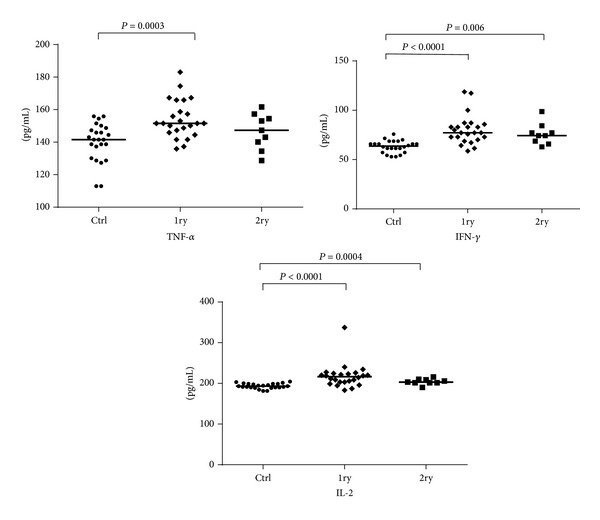
IL-2, TNF-α, and IFN-γ levels in sera obtained from individuals with primary or secondary Leishmania infections and from noninfected controls. Cytokine levels (pg/mL) were calculated for each serum sample. Means (horizontal lines) are shown for each group. Ctrl: noninfected controls; 1ry: primary infections; 2ry: secondary infections.