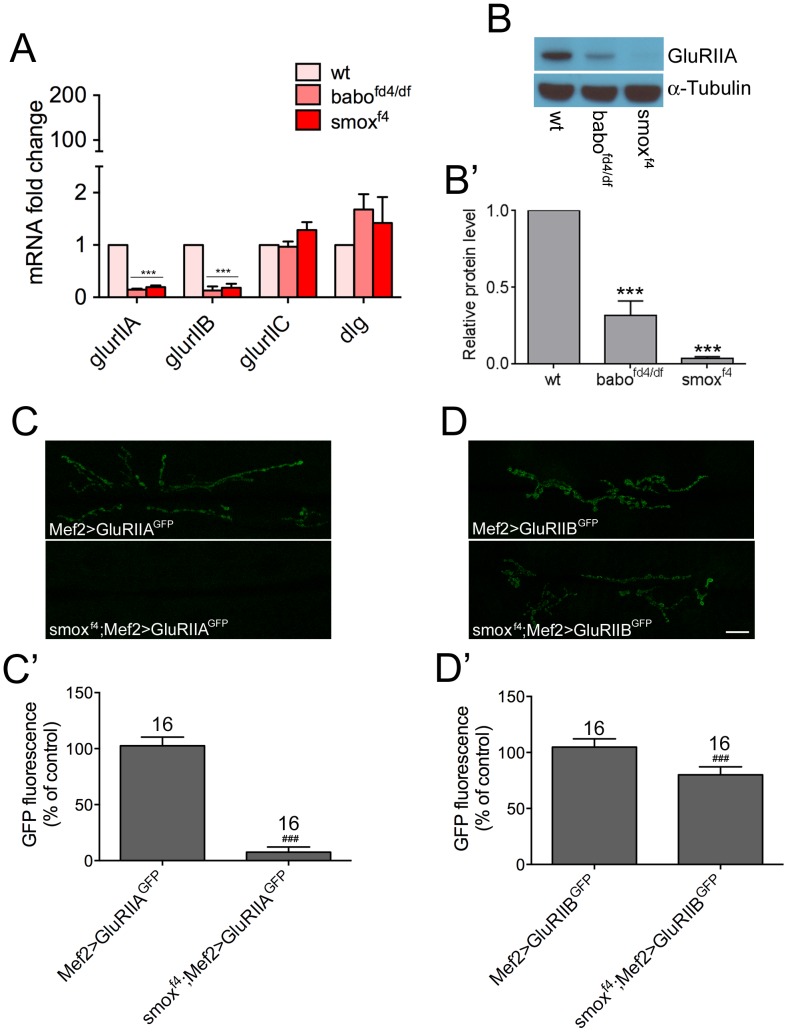
Figure 4. Synaptic GluRIIA and GluRIIB abundances are differentially regulated by Activin/TGF-β pathway.
(A) Transcript levels of glurIIA, glurIIB, glurIIC and dlg. Results from qRT-PCR assay demonstrate significant decreases in the levels of glurIIA and glurIIB transcripts in babo and smox mutants. (B and B′) Total protein level of GluRIIA. A representative blot (B) and quantification (B′). (C and C′) Exogenous expression of glurIIA-gfp in wild-type and smox mutant backgrounds. Representative confocal images (C) and quantification (C′) of GFP activity at the synapses. (D and D′) Exogenous expression of glurIIB-gfp. Representative confocal images (D) and quantification (D′) of GFP activity at the synapses. ***p<0.001 from One-way ANOVA followed by Dunnett’s multiple comparison test. ###p<0.001 from unpaired t-test. Error bars represent SEM. Scale bar equals 20 µm.

