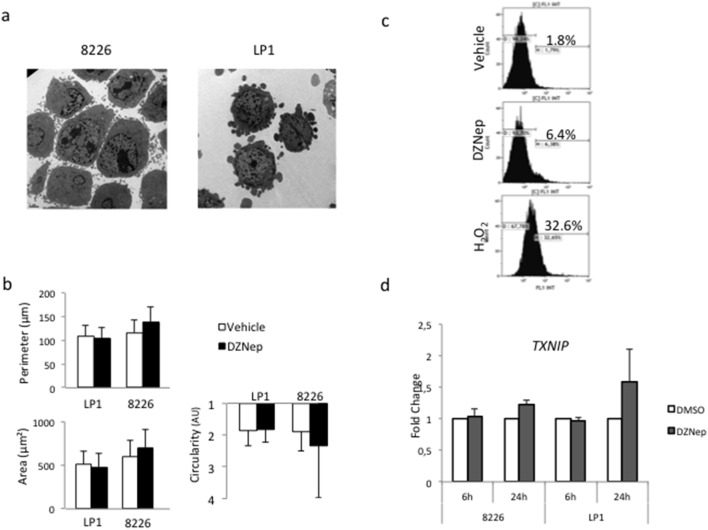
Figure 2. DZNep-induced cell death is not necroptosis.
(a) Responsive 8226 and resistant LP1 cells were either treated with vehicle or DZNep (1 µM for 24 h) then examined by transmission electronic microscopy. (b) Responsive 8226 and resistant LP1 cells were either treated with vehicle or DZNep (1 µM for 24 h). The perimeter (in µm), the area (in µm2) and the circularity (in arbitrary unit) of vehicle-(in white) or DZNep-treated (in black) LP1 and 8226 cells were determined by image analysis as described in the method section. (c) L363 cells were treated with vehicle, DZNep 1 µM for 24 h, or hydrogen peroxide (H2O2), incubated with CM-H2DCFDA before FACS analysis. At least, 2×10⁴ events were gated. The percentage of stained cells (i.e. cells producing ROS) is indicated on the graph. (d) Responsive 8226 and resistant LP1 cell lines were treated for 6 or 24 h with DZNep 1 µM. The transcriptional expression of TXNIP was determined by qRT-PCR using the ΔΔCt method with RPLP0 as internal standard. The fold change was calculated as 2−ΔΔCt. Indicated values corresponded to the mean ± SD from at least three independent experiments done with two distinct RNA preparations.

