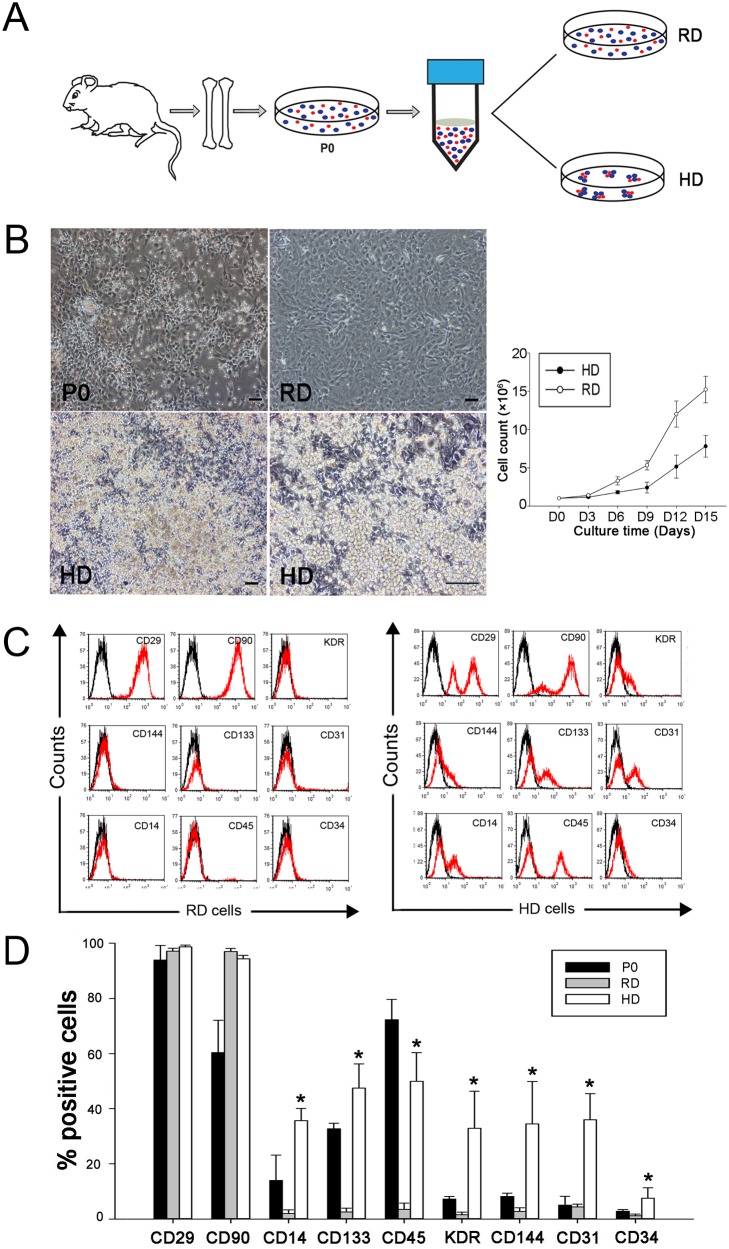
Figure 2. Characterization of bone marrow cells cultured in high density dots.
A, Diagram of the high density dot culture system. Adherent cells from primary cultures (P0) of rat bone marrow aspirates were subcultured at a regular density (RD) or in high density dots (HD). B, Typical morphologies of primary cells (P0), the cells in RD- and HD-culture at day 15, and the proliferation of cells in RD- and HD-culture (n = 3). Scale bars, 100 µm. C, Representative histograms of cell surface marker expression analyzed by flow cytometer. D, Quantitative analysis of the flow cytometric data showed higher expression levels of EPC related markers in high density cultured cells (n = 3). *p<0.05.

