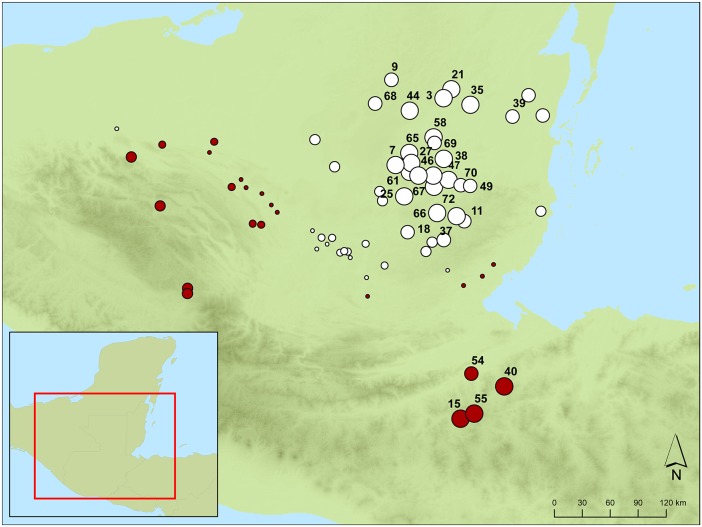
Figure 8. Bubble graph of standardized Gi* scores at a lag distance of 150 kilometers.
Bubble area is proportional to |Gi*|. Red bubbles represent positive Gi* scores, where ch’ahb’ bloodletting rituals are recorded. White bubbles represent negative Gi* scores, where there are no bloodletting records. Sites labeled with ID number have significant Gi* scores and correspond to the site names and IDs in Figure 4.

