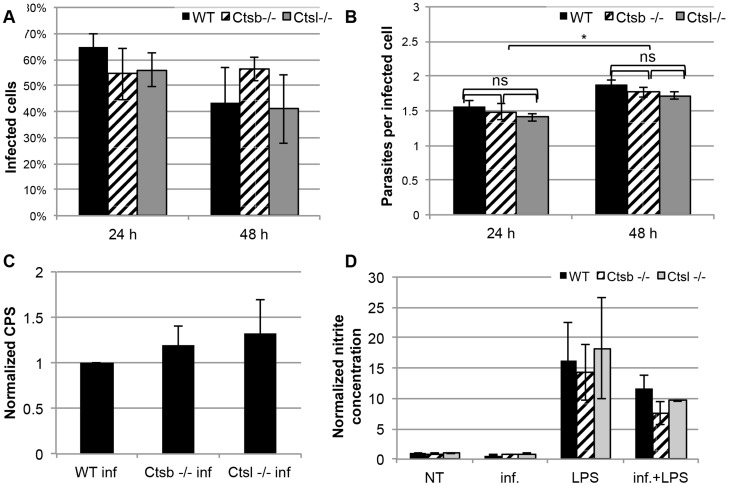
Figure 3. L. major promastigotes survive comparably in BMM from cathepsin B- and cathepsin L-deficient mice, and these BMM show similar levels of NO production in response to L. major and LPS.
WT, Ctsb−/− and Ctsl−/− BMM were infected with eGFP-tg L. major promastigotes, and the percentage of infected cells 24 hours post infection (p.i.) and 48 hours p.i. was determined by fluorescence microscopy (A). No statistically significant differences were found in the amounts of infected cells between WT and cathepsin-deficient BMM. (B) As in (A) the number of parasites per infected cells was determined by fluorescence microscopy, and used as an indicator for parasite proliferation. Although no significant differences were found between WT and cathepsin-deficient BMM, each line showed significant differences in the counts of parasites per infected cell between 24 hours and 48 hours p.i. (C) Parasite proliferation determined by luminescence of Luc-tg L. major promastigotes within BMM at 48 hours p.i. Data are shown as counts per second (CPS). (D) NO production in supernatants from BMM 48 hours after infection with L. major and stimulation with LPS. Results are expressed as mean ± SD from 3 independent experiments.

