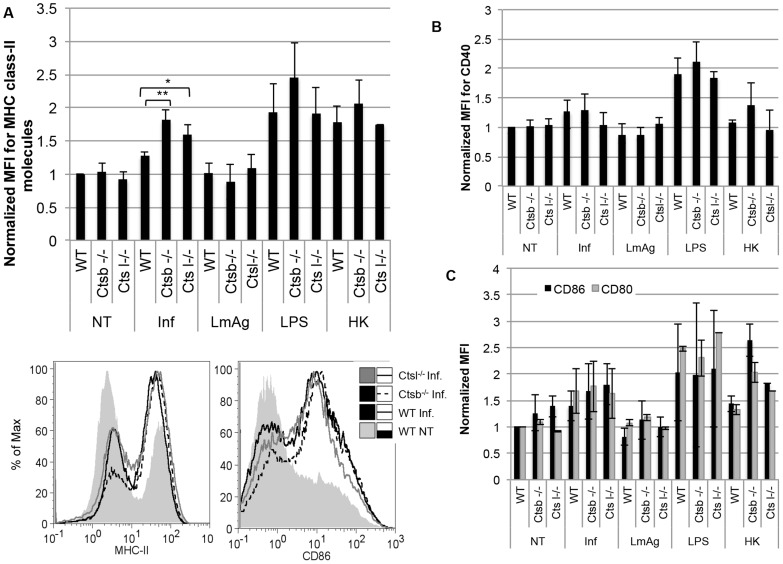
Figure 4. BMDC from cathepsin B-deficient mice express higher levels of MHC class II molecules in comparison with BMDC from cathepsin L-deficient and WT mice, but no differences were observed in the expression of co-stimulatory molecules.
The expression of MHC class II molecules, CD40, CD86 and CD80 was measured by flow cytometry in BMDC in response to infection with L. major promastigotes (Inf), LmAg, heat-killed parasites (HK), or LPS. (A) Average MFI of MHC class II molecules, normalized to non-treated (NT) WT BMDC. (B) Average MFI of CD40, normalized WT NT BMDC. (C) Average MFI of CD80 and CD86, normalized WT NT BMDC. MFI values are expressed as mean ± SD of 4 independent experiments. Statistical significance was assessed between WT BMDC and Ctsb−/− BMDC, and between WT BMDC and Ctsl−/− BMDC for every single treatment, * p<0.05, *** p<0.005.

