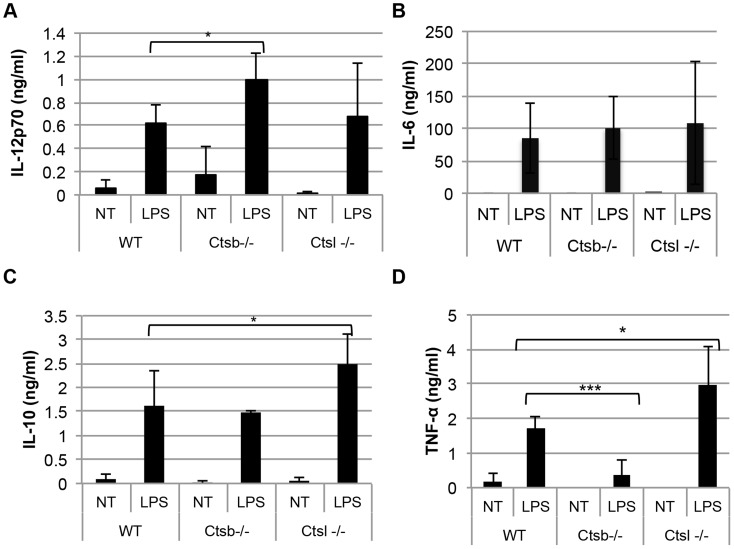
Figure 6. BMDC from cathepsin B-deficient mice express higher levels of IL-12 in response to LPS than cells from WT and cathepsin L-deficient mice.
Concentration of different cytokines in supernatants from non-treated BMDC (NT) or LPS-stimulated BMDC (LPS, 1 µg/ml) after 24 hours: (A) IL-12p70, (B) IL-6, (C) IL-10, and (D) TNF-α. The results are expressed as mean ± SD of 5 independent experiments. The statistical significance in each treatment was assessed between WT and Ctsb−/− BMDC, and between WT and Ctsl−/− BMDC. * p<0.05, **p<0.01, *** p<0.005.

