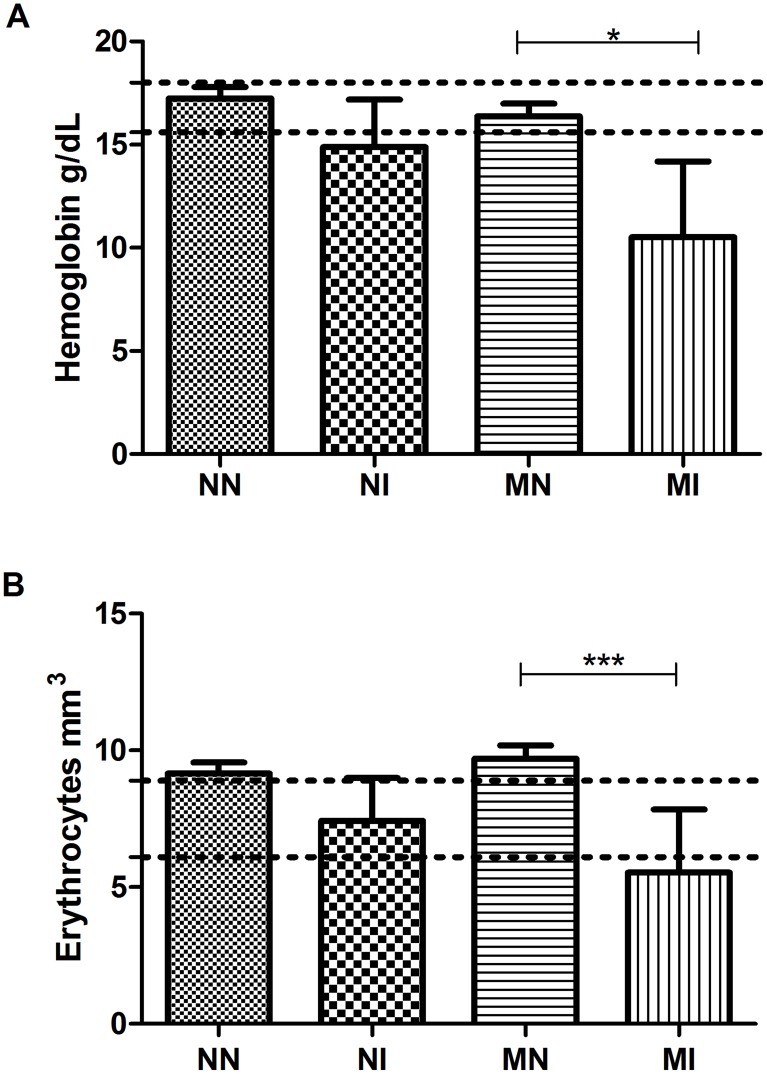
Figure 4. CBC of hamsters performed on day 50 of the experiment.
(A) Hemoglobin levels are listed in grams per deciliter; (B) Global count of erythrocytes per cubic millimeter. Negative control group (NN), control infected with A. ceylanicum (NI), malnourished negative (MN) and malnourished infected with A. ceylanicum (MI). Dotted line: physiological values for hamster according Mitruka and Rawnsley (1981). n = 5/6/10/7 hamsters per group, respectively. * = P<0.05, *** = P<0.001.

