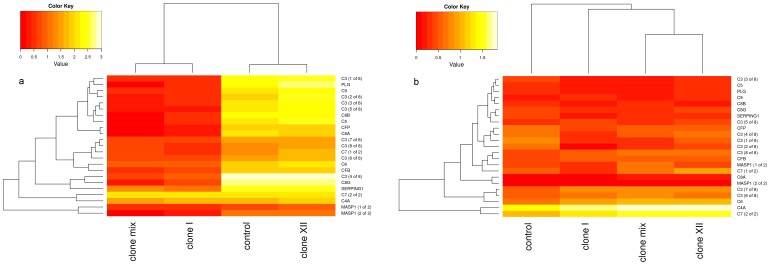
Figure 4. Heat map of genes attributed to the complement system.
Shown are transformed FPKM values indicating high (bright) and low (dark) expression of genes for both mono-clonal, clone I (I) and clone XII (XII), and the clone mix (M) treatment as well as for the control in (a) head kidney tissue and (b) gills.

