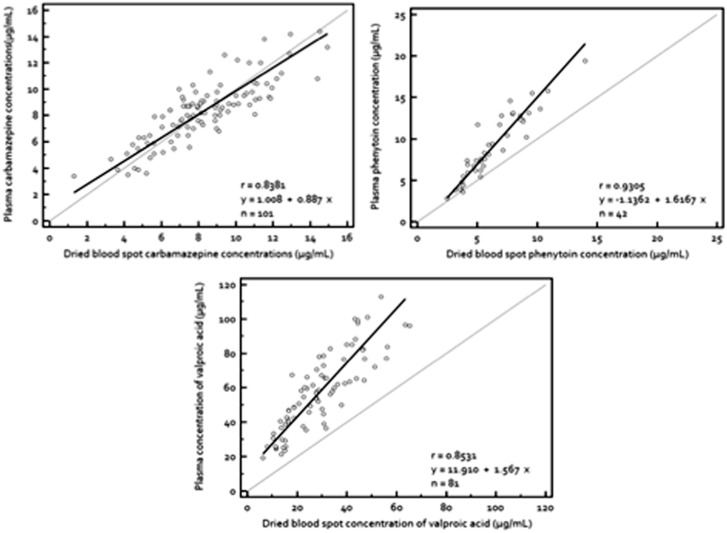
Figure 1. Correlation of plasma concentrations of AEDs with their corresponding dried blood spot concentrations.
Plasma concentrations of (top left) carbamazepine (top right) phenytoin and (bottom) valproic acid regressed against their dried blood spot concentrations using Deming regression. The broken line is the line of unity while the continuous line is the line of regression. The (top left) slope is 0.84 (95% CI, 0.76 to 1.00) and the intercept is 1.00 (95% CI, 0.04 to 1.97) for carbamazepine, (top right) slope is 1.61 (95% CI, 1.39 to 1.84) and the intercept is −1.14 (95% CI, −2.40 to 0.12) for phenytoin and (bottom) slope is 1.57 (95% CI, 1.33 to 1.81) and the intercept is 11.91 (95% CI, 5.73 to 18.09) for valproic acid.

