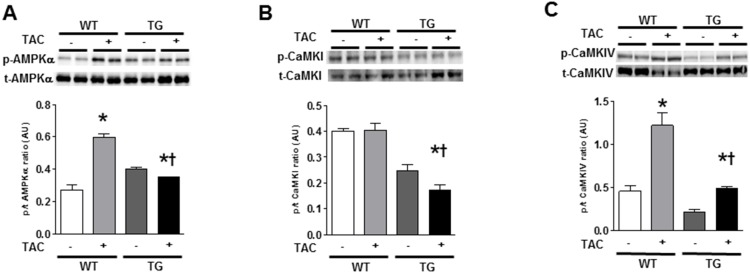
Figure 4. Phosphorylation of downstream targets of CaMKKβ in WT and α-MHC CaMKKβkd TG mice with or without TAC.

Representative pictures of immunoblotting for phosphorylated form and total amount of adenosine monophosphate (AMP)-activated protein kinase (AMPK), calcium/calmodulin-dependent protein kinase (CaMK) I, and CaMKIV (A–C). Results of densitometric analysis are indicated. Values are the means ± S.E. of five mice (*p<0.05 vs sham control, †p<0.05 vs WT after TAC).
