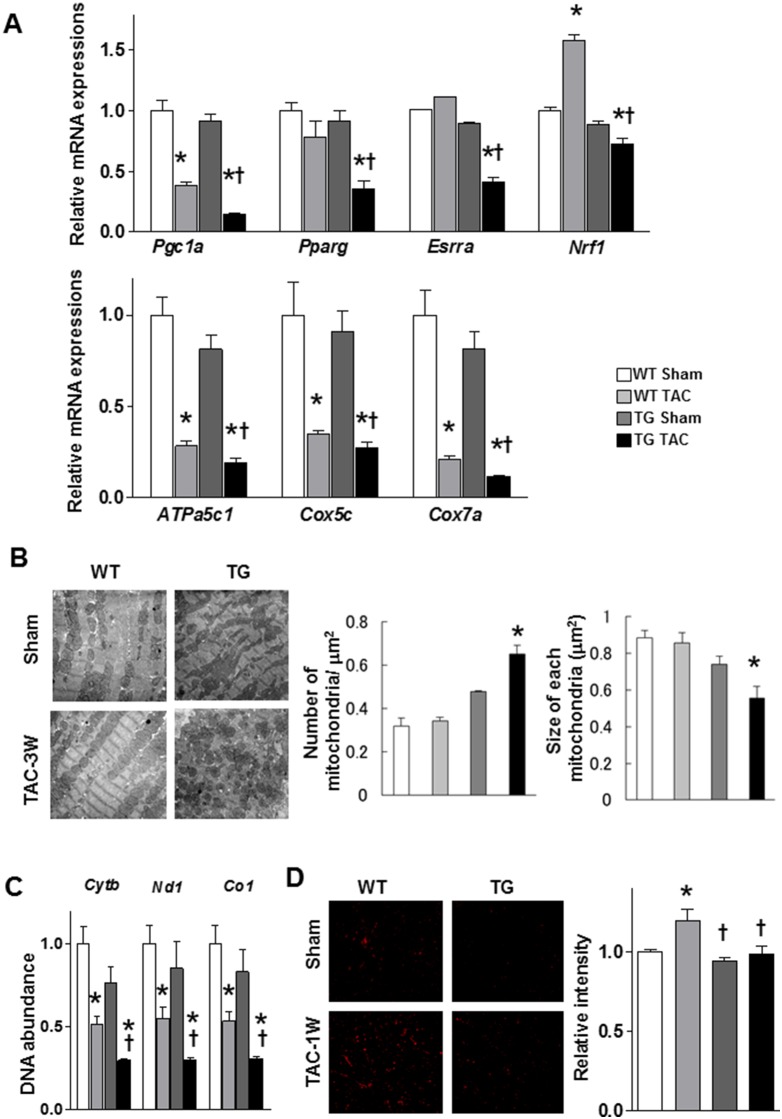
Figure 5. Mitochondrial ultrastructure, DNA abundance, and metabolism-related gene expression levels in WT and α-MHC CaMKKβkd TG mice with or without TAC.
A. Relative mRNA expression levels related to mitochondrial function and biogenesis. Values are the means ± S.E. of six mice (*p<0.05 vs sham control, †p<0.05 vs WT after TAC). B. Abnormal mitochondrial ultrastructure in α-MHC CaMKKβkd TG hearts after TAC. C. The amount of mitochondrial DNA quantified by quantitative PCR. Cytochrome b (Cytb), NADH dehydrogenase subunit 1 (Nd1) and cytochrome c oxidase 1 (Co1) expression levels relative to nuclear DNA in the ventricles of WT and α-MHC CaMKKβkd TG mice with or without TAC are shown. Values are the means ± S.E. of three to four mice (*p<0.05 vs sham control, †p<0.05 vs WT after TAC). D. Superoxide levels detected using a superoxide-sensitive dye, dihydroethidine (DHE). Representative pictures are shown on the left. Relative intensities are shown on the right. Values are the means ± S.E. of three to six mice (*p<0.05 vs sham control, †p<0.05 vs WT after TAC).

