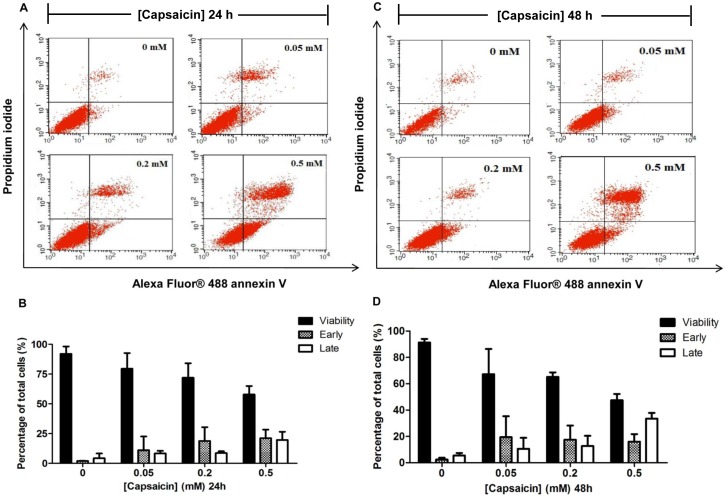
Figure 2. The effect of capsaicin on the rate of apoptosis on HepG2 cells.
HepG2 cells were treated with 0.05, 0.2, and 0.5 mM of capsaicin for 24 h (A, B) and 48 h (C, D). The above panel shows a dual parametric dot plot (A, C) of cell population detection by flow cytometry depicting the distribution of viable, early, late apoptotic, and nec rotic cells evaluated by dual staining of PI fluorescence expressed on the y-axis versus Alex flour-Annexin V fluorescence expressed on the x-axis. The percentages (B, D) of cell populations relative to the whole cell populations (set as 100%) were expressed by bar charts showing the proportion of viable, early, and late apoptotic cells. The control was defined as cells treated with a medium or vehicles without capsaicin. Data from at least three independent experiments performed in at least triplicates are presented as means ± SD, n = 7.

