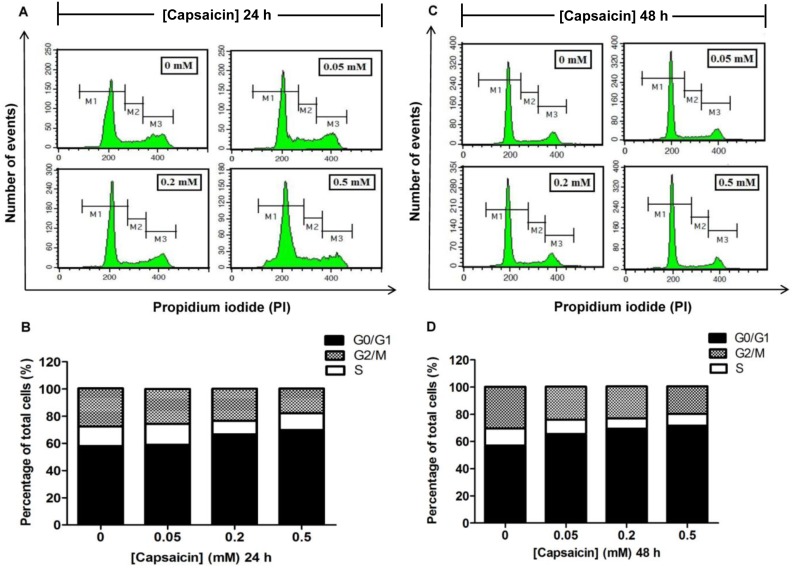
Figure 4. The effect of capsaicin on cell cycle distribution in HepG2 cells.
HepG2 cells were incubated with 0.05, 0.2, and 0.5 mM of capsaicin for 24 h (A, B) and 48 h (C, D). The above panel (A, C) shows the histogram profile of cell cycle distribution in G0/G1, S, and G2/M phases detected by flow cytometry using PI staining. The bar chart (B, D) shows the percentage of cell populations in each phase of the cell cycle relative to the whole cell populations (set as 100%). The control was defined as cells treated with a medium or vehicles without capsaicin. Data are expressed as means ± SD from at least three separate experiments performed in triplicate, n = 3.

